I have about 250 client on an AWS AMI instance backing up 15TB currenlty. Workstaion OSes are set to incremental every 8 hours and retain 42 iterations and servers to backup every 24 hours and keep 62 iterations. My nightly cleanup has kicked off and has been running for days. The webUI is all but unusable to troubleshoot. Just logging in takes 10-15 minutes, if it works at all. I have already tried to increase the instance to a t3.xlarge. That did seem to help in that I no longer get as many down/up/down monitoring emails but has not resolved the issue. I assume this is something of a bottleneck with the S3 storage (Infrequent Access)? How can I best troubleshoot this to a resolution?
A way to see the bottleneck is to go to Settings -> System -> Access server statistics (netdata).
The CPU graph on top should directly show if the CPU is the bottleneck (100% CPU usage, low iowait). If yes, e.g. use worse compression in the advanced cloud drive settings.
If login takes long, I’d guess it has a lot of dirty memory (Memory -> Kernel -> Dirty). Maybe the system disk is heavily used. Take a look at Disks -> xvda usage/backlog/read-write IO/s.
Also have a look at how much IO there is to the cache device (xvdb) and if that one is the bottleneck w.r.t. IOPS.
Then Storage -> clouddrive shows total storage IOPS, cache miss IOPS (backend IOPS – those would be where it has to load from S3) and where it has to decompress cache. You’ll also be able to see how much it is currently queued for upload and how fast it is uploaded. If you have a lot of backend IOPS a larger cache would be needed (or a faster S3 storage category). Maybe try “Intelligent tiering”?
I guess the AWS console should show if your “t3.xlarge” gets throttled (CPU credit balance/Volume burst balance)? AWS does that quite aggressively…
CPU is consistently at 100%. Can you elaborate on what the different compression options correlate to? I can’t find anything documented. iowait seems to also hover around 80%.
Cloudrive - storage currently has nothing pending since its set to work on that after hours at the moment. the cache storage. is 1TB.
If iowait is 80% then it only uses 20% CPU and it is not the bottleneck… and one of the disks/cloud storage is the bottleneck
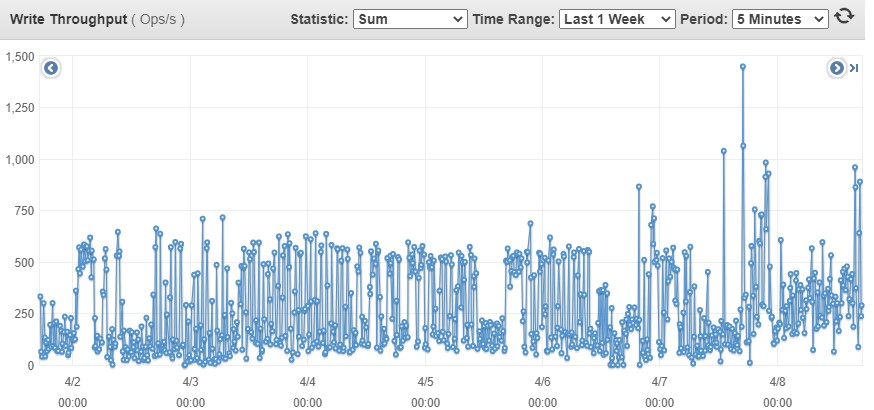
It seems like then it may be the cache drive or the compression. For the cache drive, I am already using 1TB SSD GP3. My next options would be a provisioned iOPS EBA volume. I’m not sure though how to really dig in and see if that is the issue. Looking at the graph, I see IO backlog hovering around 5 seconds. Some of the graphs are showing negative numbers on writes which doesn’t make much sense either.
On the S3 cloud storage, I am not doing any tiering but did select infrequent access from the web ui. I see the compression options in advanced but I don’t know what its using now (default) and how that related to ztsd 3, 9, 19 and lzma 5. Also, what is the difference between compression method setting and background compression method? Are those settings documented somewhere?
As said, if it doesn’t have 100% CPU usage + a back log of objects to submit it is unlikely to be the compression.
So that gets 3000 IOPS per default (without upgrade). How many IOPS does netdata show for the device?
That’s just how it is able to show read+writes in a single graph without overlap.
Some are are in the manual (link on the bottom).
To decrease cache IOPS:
- Use RAM as cache (requires some instance RAM e.g. 40GB)
- Disable “Increased number of crash-persisted cache items” (minimal improvement)
- Compress cache with ZSTD (better but more CPU) or LZO
- “Tune cache device for low IOPS (<10k IOPS)” gives minimal improvement
I’m seeing frequent iops bursts over 3k operations. some as high as 8k.
Perhaps it averages it or something. Idk. The AWS console should also show IOPS and limits?
Btw. what prevents one from attaching say 64 16 GiB gp3 volumes instead of one 1TiB volume to get 64*3000 IOPS for the cache?

Fair point. The AWS side seems to show a much more reasonable picture of iops. I supposed you could provision many cache volumes but that too doesn’t seem to be the limiting factor.
After a snafu with cache drives and having to recreate the appliance, we now have an instance on the new AMI with all GP3 drives. I allocated some additional iOPs and throughput on the drives as well as switched to an m4.xlarge instance type. Iowait is now lower, around 30% with CPU still hitting 100%.
I went into advanced storage and tried to set the compression to ZSTD3 with a background rewrite of 60% but the compression method seems to always be set to default on reboot. Not sure if that is just a UI bug.
My issue now is that the cache drive is getting filled up. I get the message that the backend storage cannot keep up and to migrate to faster storage or expand the cache. With S3, I can only realistically do 1 of those. When this happens, I don’t see and cloud upload happening even though I have 1-7/0-24 in the window configuration. I tried also setting the minimum commit to 5 minutes but the cloud upload happens in spurts. Will I need then expand my cache? I am trying to back up 100 devices at a time with a 1TB cache.
It seems to correctly save, then not show it correctly (and you have to change it again before saving). Will be fixed.
Filling up is good. Filling up and then not being able to write it to S3 fast enough is “bad”. If you are starting over with full backups it might be the initial large amount of data though and won’t be a long term problem…
That’s weird. Can you have a look at the tail of /var/log/clouddrive.log ? If it gets throttled it should always upload. (Maybe also take a look at iotop and what tclouddrive threads are running).
Each time I open the advanced settings I need to save? Or just when something is changed? When I went in after reboot and checked, that should not have reverted correct?
So it looks like when the new instance was created, we neglected to save the key pair so we may need to either recreate the instance or perform some steps in AWS to add a new one. In the meantime, I uploaded logs from the support link on the application (ID 181).
I has concurrent backups limited to 25 at the moment and it is filling up the 1TB cache and getting stuck, not allowing new backups. We do have many new clients coming on board each week as well. I don’t see that metric in netdata.
Only relevant thing in the logs I can see is
2021-04-12 14:04:41: WARNING: AWS-Client: Request failed, now waiting 0 ms before attempting again.
2021-04-12 14:04:41: ERROR: AWS-Client: Curl returned error code 28 - Timeout was reached
2021-04-12 14:04:41: ERROR: AWS-Client: HTTP response code: -1
Exception name:
Error message: curlCode: 28, Timeout was reached with address : 52.219.80.200
0 response headers:
(s3 timeout – shouldn’t happen, I guess – the s3 bucket is in the same region as the server?).
Correct. EC2, EBS and S3 are all in the same region.
Any other ideas to try other than increasing the cache drive size? I still see the cloud upload being paused with a full cache drive and backups stacking up in wait. Is ENA enabled on the AMI? Seems that though may also be tied to the instance type.
I think so. sudo ethtool -i eth0 would confirm it… I guess you could look at the netdata/aws network graphs if networking in the bottleneck?
Did you check the CPU credit balance graph?
I don’t have SSH at the moment. I will need to get a new instance created so I can export the key pair this time.
It’s pushing a lot through the network but I believe the cap is 10G for this instance type.

I’m not seeing an CPU credit data yet, I assume because of how short this one has been online.
I think I read somewhere that it is available after 5min…
You can also use the web shell at Settings → System → web shell
It looks like ENA is enabled based on the driver that is loaded.
Also, I realized after I typed me last reply that there are no credits on the m4 instance type since it is not a burstable architecture.
Sry, still had in mind that you use t3.x instances. Maybe it is the “Dedicated EBS bandwidth”? Maybe there is a ebs network bandwidth graph somewhere? 750 Mbps is a bit low compared to e.g. SATA at 6Gb/s…