I’m using prometheus (a time-series database) and grafana (a dashboard webservice) to monitor my infrastructure. Since there API bindings for both prometheus and urbackup for python3, I’ve written a simple script to translate the output of the urbackup api into prometheus time-series metrics.
The output does not contain everything I’d like to have, but it is a good start. Let me know what you think, maybe this is useful to some people.
Imho the API could use some documentation (couldn’t find any) and be more consistent with return types; When a client hasn’t had a backup yet fields like “lastbackup” return “-” where ususally it is an int.
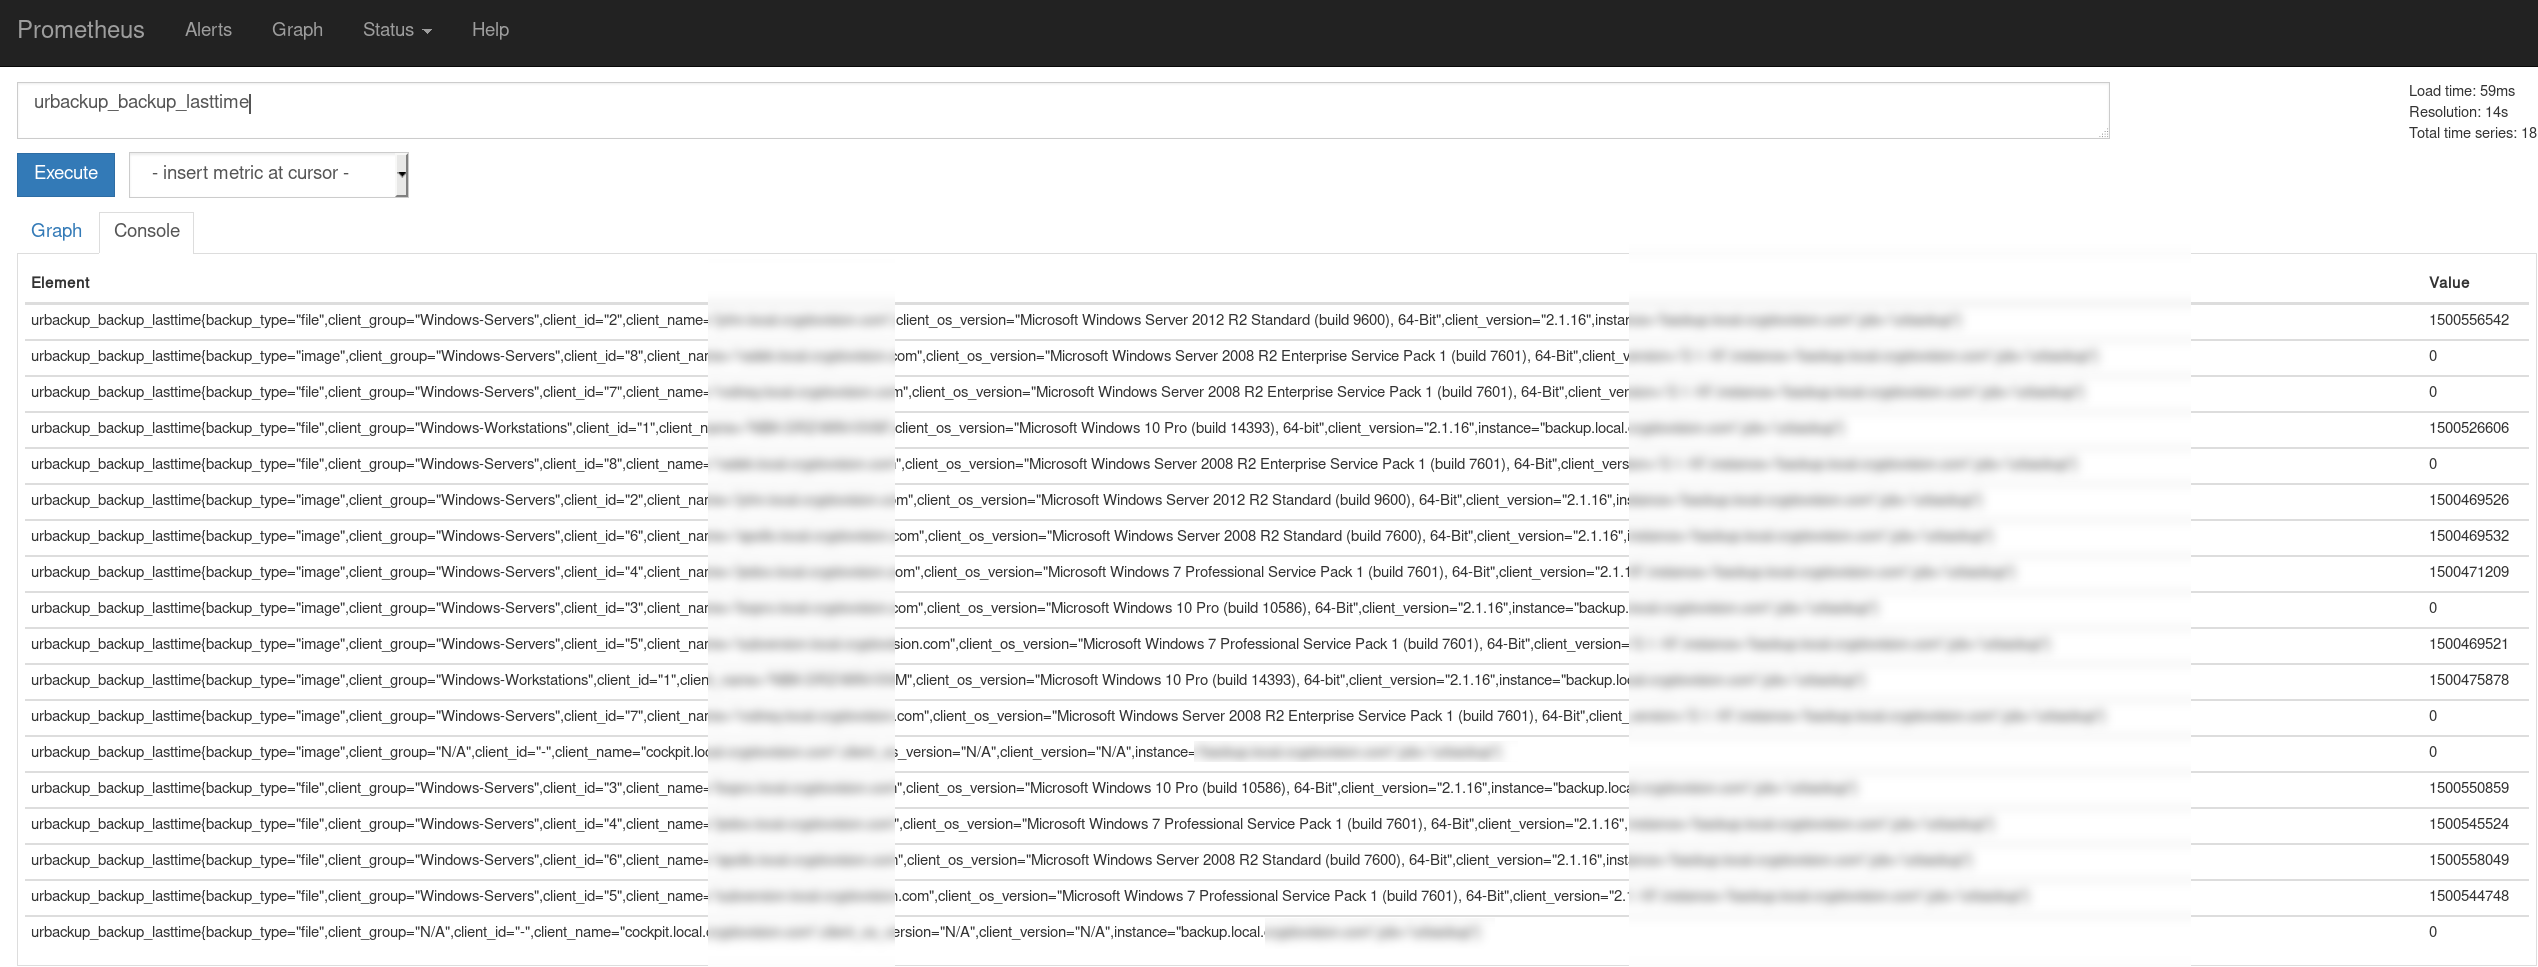
Here’s an example of the lastbackup timestamp in the database, which makes it easy to create OK/Not OK statistics in grafana and generating alerts.
Prometheus can generate alerts from the data received and alertmanager can post those to slack. Using my script directly does not make a lot of sense since it just reads data from the urbackup api and exposes it in prometheus format; it doesn’t interpret the numbers.
If you don’t have prometheus, it would make more sense to look for a slack python module and write your own script.